2.1.2 Complex Bioactive Compounds
Among the complex bioactive components in coffee, caffeine is one of the most well-known substances and also serves as an evaluation indicator. Typically, high-performance liquid chromatography (HPLC) and spectrophotometry are commonly used methods for quantitatively determining the caffeine content in coffee or other beverages. HPLC involves carefully injecting the sample into the equipment, followed by precise analysis using a calibration curve of standard solvents, requiring careful control of each step. Another method is the use of ultraviolet (UV) spectrophotometry according to the Chinese National Standard (GB/T 5009.139-2014). These methods all require specific preparation and proper storage of redistilled chloroform. For both techniques, caffeine standard stock solutions need to be stored below 4°C and should be used as soon as possible. Whether by chromatography or spectrophotometry, these caffeine analysis methods are cumbersome and time-consuming.
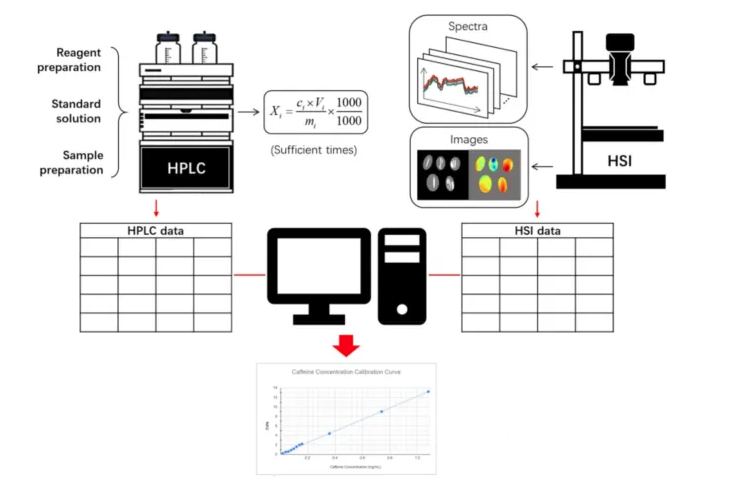
Figure 2 shows the process of using hyperspectral imaging (HSI) technology to detect caffeine in coffee beans.
This method is very promising, especially in the later stages of practical application, because it only requires a limited number of chemical tests during the initial stage of developing the calibration model. Once sufficient models are developed for specific applications, HSI technology can provide accurate and real-time caffeine predictions by scanning the target object. A key issue is the degree of correlation between caffeine content and HSI data. Although the model performance standards shown in Table 2 vary, researchers have successfully used near-infrared (NIR) spectroscopy to establish models for caffeine in green and roasted coffee beans. However, there is still room for further research, especially in exploring alternative algorithms beyond linear regression and extending caffeine analysis to liquid coffee.
Chlorogenic acid is present in several fruits and vegetables, particularly in coffee beverages, and is a basic component of dietary phenols. Coffee is especially rich in chlorogenic acid, which is a metabolite of chlorogenic acid. People who drink coffee regularly may ingest approximately 500 to 1,000 milligrams of chlorogenic acid daily, while those who do not drink coffee typically consume less than 100 milligrams. It is estimated that a 200-milliliter cup of coffee contains about 70-350 milligrams of chlorogenic acid, equivalent to 35-175 milligrams of chlorogenic acid and chlorogenic acid. Chlorogenic acid and chlorogenic acid are believed to prevent cardiovascular disease and colon cancer. In the human body, one-third of the absorbed and unabsorbed chlorogenic acid may be beneficial to health in the bloodstream and colon. Currently, HSI has only studied chlorogenic acid and phenolic compounds in roasted beans.
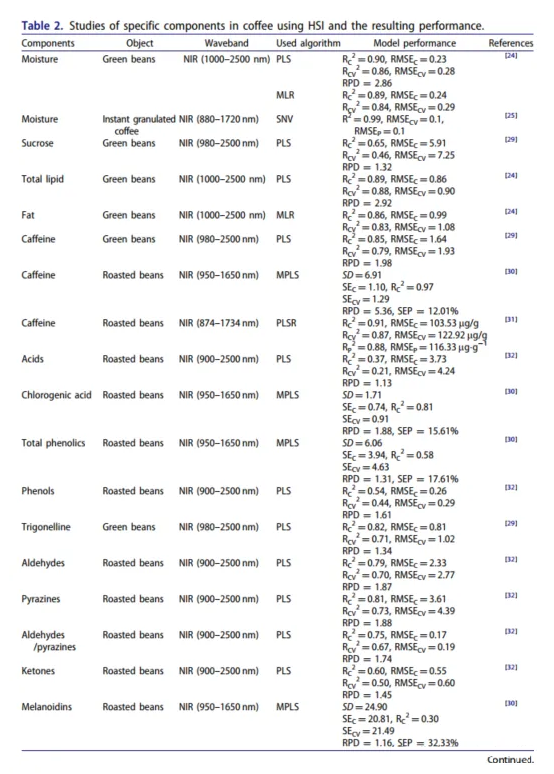
NIR: Near Infrared; PLS/PLSR: Partial Least Squares Regression; SNV: Standard Normal Variate; MLR: Multiple Linear Regression; MPLS: Modified Partial Least Squares;
MCR-ALS: Multivariate Curve Resolution Alternating Least Squares; R': Coefficient of Determination; Rc: Calibration Coefficient of Determination; Rcv: Cross-Validation Coefficient of Determination; Rp: Prediction Coefficient of Determination;
RMSE: Root Mean Square Error; RMSEc: Calibration Root Mean Square Error; RMSEcv: Cross-Validation Root Mean Square Error; RMSEp: Prediction Root Mean Square Error;
RPD: Relative Performance Deviation; SD: Standard Deviation; SE: Standard Error; SEc: Calibration Standard Error; SEcv: Cross-Validation Standard Error; SEP: Prediction Standard Error; AE: Absolute Error.
Employed near-infrared band technology combined with linear regression methods, but the results were not satisfactory. Additionally, researchers tested a series of other bioactive compounds in coffee, including ketones, aldehydes, pyrazines, and melanoidins, and the obtained correlation coefficients (R²) were below 0.90. Besides these components, protein is also a common and essential bioactive component in green coffee beans, composed of various amino acids related to coffee aroma generation during roasting. Currently, research on protein content in coffee is still limited. One noteworthy study conducted in visible light-near-infrared hyperspectral imaging predicted the extractable protein in roasted coffee beans with an R² value of 0.76, focusing on identifying the roasting categories of different coffee brands. It is worth noting that although people are interested in monitoring caffeine intake and the impact of chlorogenic acid on coffee flavor, there are currently no affordable and portable devices on the market for consumers to perform instant on-site detection at home or in cafes. The only user-friendly device currently on the market is the CA700 portable caffeine/chlorogenic acid (CGA) analyzer (from Lighttells Company in Hsinchu, Taiwan). The device is designed to measure caffeine and chlorogenic acid content in coffee, can connect to smartphones, and provides results within one minute (according to its user manual). However, due to its high price, it is still primarily used as a tool in professional laboratories. Therefore, further development in HSI technology is needed to create more accessible and affordable alternatives for daily use.
2.1.3 Adulterants
Unlike the original defects in coffee beans, adulteration is typically an intentional act aimed at maximizing profits. Common adulterants often include foreign substances such as grains, twigs, and coffee-related by-products like coffee husks, berry peels, parchment, or used coffee grounds. Additionally, low-quality coffee is sometimes mixed with high-grade varieties. Currently, various techniques are available for detecting adulteration in coffee and other products. These methods primarily rely on specific analytical approaches, such as high-performance liquid chromatography (HPLC), gas chromatography-mass spectrometry (GC-MS), and enzyme-linked techniques. Although these targeted methods are highly accurate in identifying adulteration and have been widely applied, they are costly, time-consuming, complex, and limited to laboratory environments. Furthermore, as these methods focus on detecting specific markers based on preset targets, they provide limited information and may not fully address complex food fraud or certification challenges. Given the wide variety of adulterants that could be used in food fraud, identifying only one or a few specific markers is insufficient for comprehensive product certification unless there is clear suspicion of a specific adulterant. Therefore, there is an urgent need for non-targeted analytical tools to supplement or replace current targeted methods for food certification. Fingerprinting techniques, particularly spectroscopic techniques, can be used to verify authenticity and identify adulteration events. However, traditional spectroscopic techniques generate average spectra by scanning multiple points on a sample for correlation with machine learning models, which sometimes produce non-representative averages, leading to inaccurate predictions. In contrast, HSI captures the spectrum for each pixel in an image, uniquely providing detailed information about the presence, quantity, and spatial location of analytes. This capability makes HSI a highly promising technology for detecting adulteration in coffee. Although attempts have been made to successfully detect adulteration in coffee using infrared spectroscopy, multispectral imaging, and mass spectrometry, the application of HSI technology in this field has received little attention. However, scientists have demonstrated the effectiveness of HSI by successfully identifying adulterant mixtures in roasted and ground coffee adulterated with soil, sticks, cornstarch, and coffee husks, achieving an R² value greater than 0.90. This achievement highlights the strong potential of HSI as a practical method for distinguishing adulterants in coffee products.
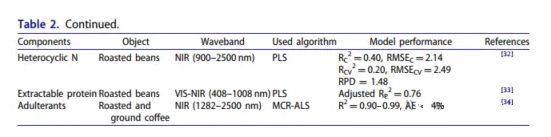
2.2 Defect Inspection
Coffee defects can exist throughout the entire coffee production process from seed to cup. Figure 3 shows some typical defects that may occur at various stages of coffee production. In Section 2.1, impurities, adulterants in coffee related to coffee composition analysis and aroma prediction, as well as flavor loss related to chemical changes, have already been discussed. Currently, most HSI-based coffee research focuses on the planting, processing, and roasting stages, with the subjects being coffee leaves, green coffee beans, and roasted coffee beans.
Figure 3 Defects from coffee beans to coffee courses
2.2.1 Planting and Harvesting Stage
Coffee leaf rust is one of the most serious diseases in the planting stage, affecting coffee production. It is caused by the fungus Hemileia vastatrix. This obligate parasitic fungus reduces the activity of photosynthesis, leading to leaf fall and even plant death, which can result in significant yield reduction and huge economic losses. Therefore, early diagnosis or timely detection of coffee rust infection is crucial.
Table 3 includes two studies based on hyperspectral imaging technology regarding coffee leaf rust caused by H. vastatrix. Although the researchers adopted different experimental methods in grouping samples or managing datasets, both studies successfully achieved satisfactory overall classification accuracy. Soares et al. collectedurediniospores from the field to infect coffee leaves, at the phenological stage, and divided the total samples into inoculated and non-inoculated groups to compare the spectral characteristics of certain days after inoculation, using vegetation indices (VIs). The results showed that support vector machines (SVM) were most effective in differentiating the two groups 30 days after inoculation, with an overall accuracy of 85%. In contrast, artificial neural networks (ANN) performed best on the same day, with an overall accuracy of 80%. Castro et al. classified the health status of coffee leaves into five different categories, each related to visual appearance or color. They used principal component analysis (PCA) during the preprocessing stage to reduce dimensionality, and SVM showed the highest classification accuracy among the classifiers used, at 94.7%. These studies provide a new and relatively comprehensive exploration of the spectral and spatial information obtained from hyperspectral imaging technology for the supervised detection of coffee leaf rust in its early stages.
As shown in Figure 3, after the planting stage, the ripe coffee fruits are harvested. Before being processed into beans, they are actually encased in external fruit skins and flesh, which are known as coffee cherries. Coffee cherries are rich in plant nutrients, with over two hundred identified varieties, including caffeine, chlorogenic acid, alkaloids, flavonoids, ferulic acid, and others, which offer numerous health benefits to humans. During the processing, the fruit skins and flesh of the coffee cherries are removed, leaving green coffee beans for subsequent roasting. After initial cleaning, wet and dry methods are the two main processing techniques for converting mature coffee cherries into coffee beans. As the name suggests, wet processing uses water to clean the fruits, followed by steps such as hulling, fermentation, secondary cleaning, hull removal, and drying, with final packaging; dry processing involves natural drying first, followed by sequential cleaning, hull removal, and selection, with final packaging. The entire process is highly complex and generates a significant amount of waste. Additionally, with the rising trend of seeking unique and fresh flavors, especially among young people, it has spurred innovation by beverage companies in producing drinks from uncommon bases, one of which is coffee cherries. Today, coffee cherry tea (Cascara) and coffee fruit wine are the most popular beverages made from coffee cherries, and even Starbucks (https://www.starbucks.com/) introduced related products several years ago.
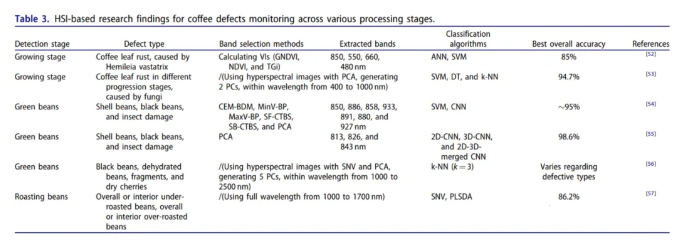
Table 3 Vi: Vegetation Index; GNDVI: Green Normalized Difference Vegetation Index; NDVI: Normalized Difference Vegetation Index; TGi: Triangular Greenness Index; ANN: Artificial Neural Network; SVM: Support Vector Machine; DT: Decision Tree; k-NN: k-Nearest Neighbor; CEM: Constrained Energy Minimization; BDM: Band Dependency Minimization; MinV-BP: Minimum Variance Band Prioritization; MaxV-BP: Maximum Variance Band Prioritization; SF: Sequential Forward; SB: Sequential Backward; CTBS: Constrained Target Band Selection; PCA: Principal Component Analysis; CNN: Convolutional Neural Network; SNV: Standard Normal Variable; PLSDA: Partial Least Squares Discriminant Analysis.
According to the author, there are currently no studies utilizing hyperspectral imaging to analyze defects in coffee cherries, which represents a gap in the field. Although hyperspectral imaging technology has significant potential, the number of studies on spectral information of coffee cherries remains extremely limited. With the consumption of coffee cherries showing a potential growth trend, there is a need for more attention to be focused on their safety and quality assessment, including defect detection. Additionally, environmentally and economically friendly by-products or waste generated from the complex processing process, such as the outer shell, pulp, pericarp, washing water, and mucilage produced during the fermentation stage, are worth further investigation.
Related products: please click here